-
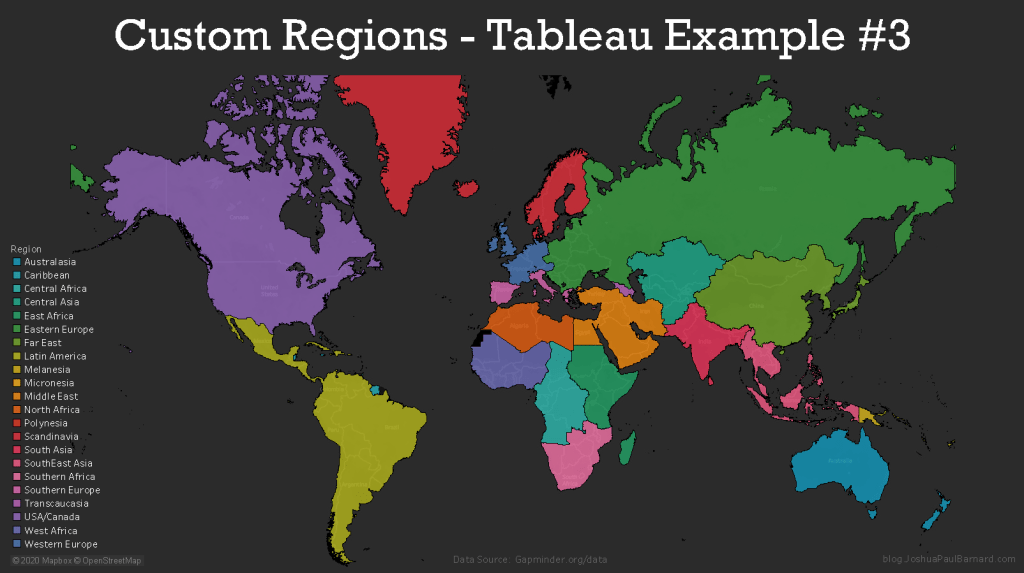
Custom Regions (Territories) – Tableau Example #3
Tableau Tutorial for creating custom regions (territories) of countries in a map.
-
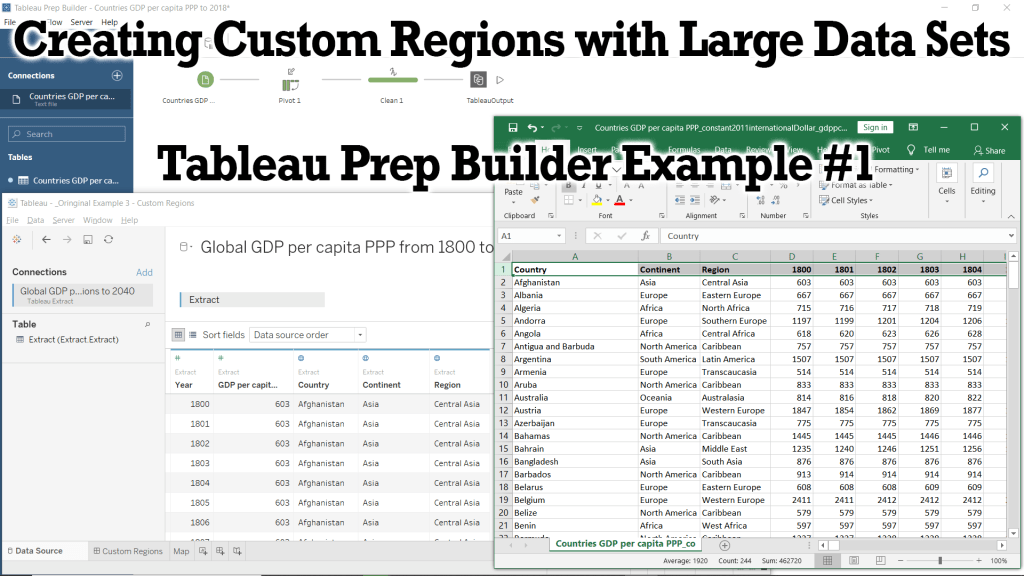
Creating Custom Regions with Large Data Sets – Tableau Prep Example #1
Tableau Tutorial for preparing our data using Microsoft Excel and Tableau Prep Builder to create a .hyper data extract. We will code our data to include continents and a custom region to each country which we will use in future Tutorials and Examples.
-
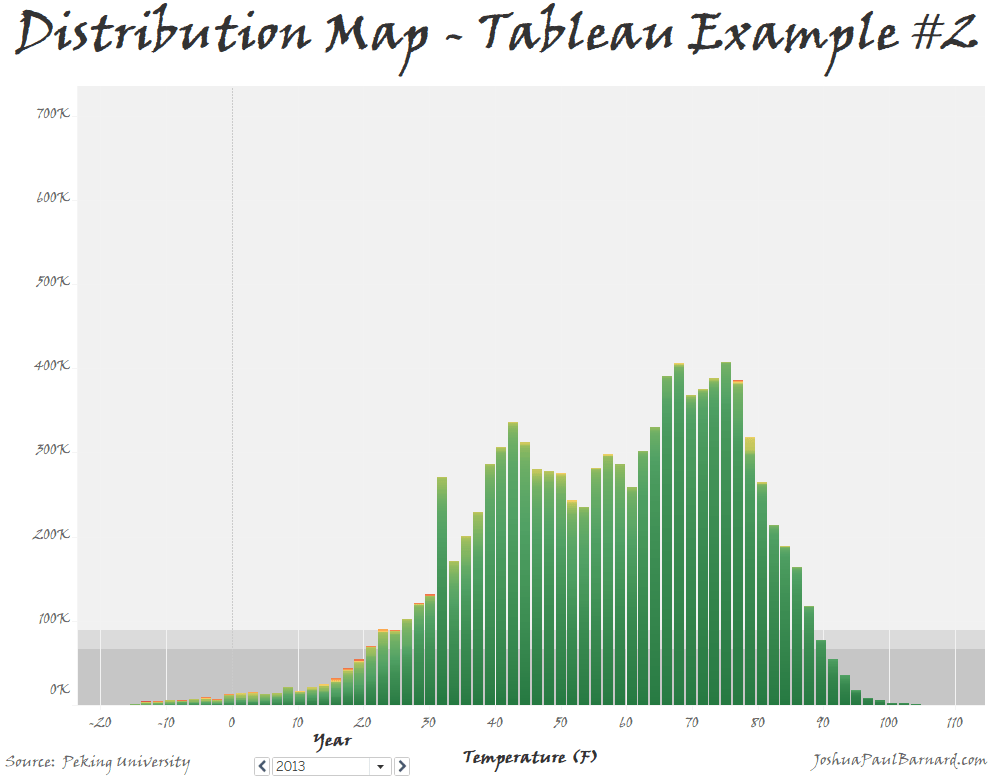
Distribution Map – Tableau Example #2
This fun little visualization allowS us to graph the distribution of a single measure or of two measures compared to each other, and then adjust the colors within the distribution graph. You can also use this visualization to easily filter and page through your data to view a breakdown of your distributions.
-
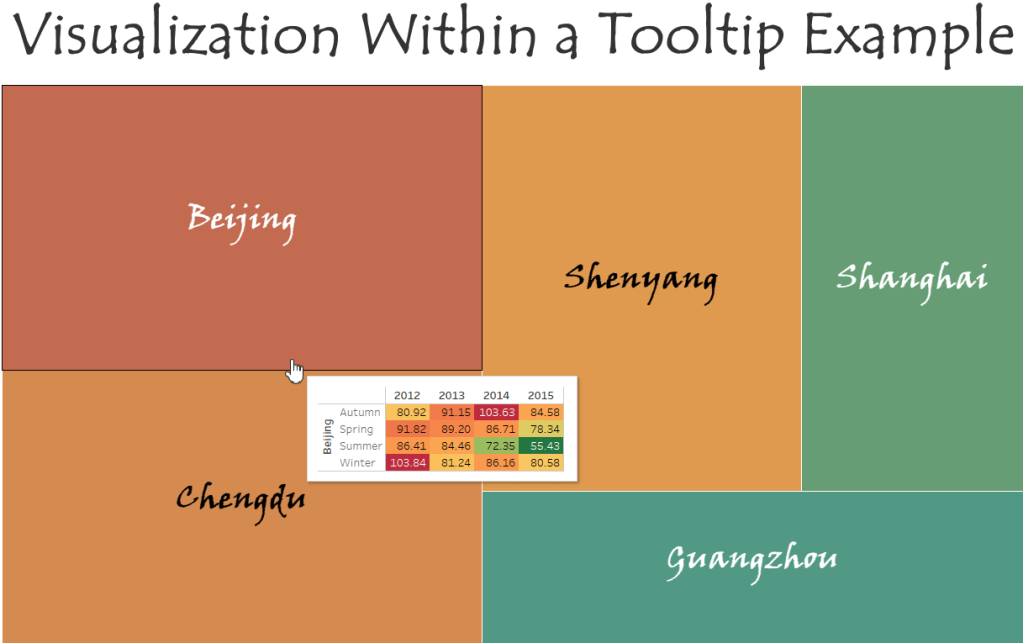
Visualizations within a Tooltip – Tableau Example #1
A step-by-step walk-through of how to add visualizations into chart tooltips.
-
Subscribe
Subscribed
Already have a WordPress.com account? Log in now.
