-
How to Build and Compile a CryptoNote Project on Linux

There has been an active issue for over 5 years now when trying to build the source on modern compilers.
The best solution (without updating the actual code) is to simulate the original build environment, Which is Ubuntu 14.04 with the Dependencies of: GCC 4.7.3 or later, CMake 2.8.6 or later, and Boost 1.55.
From my experiences, CryptoNote will also compile on Ubuntu 16 (using Boost 1.58).
I recommend using a Remote Server or Cloud Services to host your daemon, but here are (optional) instructions for how to compile your CryptoNote Coin using a VM (Virtual Machine) on Windows 10:
## Download and Install VirtualBox:
https://www.virtualbox.org/wiki/Downloads
## Download the desktop image of Ubuntu 14.04.6 LTS (Trusty Tahr)
https://releases.ubuntu.com/14.04/
# Use VirtualBox to create a VM (Virtual Machine) for Ubuntu 14.04
Note: I recommend changing the Settings for your VM to allow Shared Clipboard.
Note: You may need to enable virtualization in your system’s BIOS settings.Open VirtualBox
Click New
Type a Name (it can be anything)
For ISO Image, select Other…
Then choose the image file (ubuntu-14.04.6-desktop-amd64.iso)
Start the VM, and allow Ubuntu 14 to install.
# Virtual Box does not add the default user (default is: vboxuser) as a super user, so we need to add it ourselves.
Reference (from Solving Case #1): https://www.tecmint.com/fix-user-is-not-in-the-sudoers-file-the-incident-will-be-reported-ubuntu/
– After Ubuntu 14 has installed, close the VM.
– Restart the VM, and
– Press the shift key once when the VM powers on.
– Using the Down Arrow, select “Advanced options for Ubuntu” and press Enter.
– Select the kernel with the “(recovery mode)”.
– Move over to the line “root Drop to root shell prompt”, then hit Enter.
– Type the current password (default is: changeme)
mount -o rw,remount /
adduser vboxuser sudo
reboot
Installing Dependencies
## Installing cmake 2.8.12.2
sudo apt-get update
sudo apt-get install cmake
cmake –version
## Installing gcc version 4.8.4
Note: gcc should already be installed, but if not, then follow these instructions
sudo apt-get update
sudo apt-get install gcc
gcc -v
## Installing boost c++ libraries version 1.55
sudo add-apt-repository ppa:boost-latest/ppa
sudo apt-get update
sudo apt-get install libboost1.55-all-devdpkg -l | grep libboost
## Installing Git
sudo apt-get update
sudo apt-get install git
git –version
# Install QT (at least 5.2.1) for compiling the wallet:
sudo apt-get install qtbase5-dev
Compiling the Cryptonote Project
git clone https://github.com/%5BYour Github Account Name]/[Your Coin’s Github Repository].git
cd [Your Coin’s Github Repository]
mkdir build
cd build
cmake .. && make
Check my Windows 32/64-bit guide if you need help compiling your CryptoNote project on Windows 7+.
-
How to Compile a CryptoNote Coin on Windows
This guide is to help developers compile their CryptoNote Coin blockchain on Windows.
Cryptonote core proved to be rather easy to compile, while the wallet proved to be far more difficult, due to the codebase being so out of date.
I made this guide on Windows 10 in October, 2023.
If you need help compiling on Linux, then you can check my Ubuntu 14/16 guide.
Windows Dependencies for CryptoNote
We are going to build for 64-bit Windows.
- Download the Build Tools for Visual Studio 2019 Installer
- When it opens up select C++ build tools, it automatically selects the needed parts. Make sure MSVC v141 Build Tools is selected.
- Install Boost v1.71.0. Select the appropriate version for your system.
- Install Qt5.
Compiling Cryptonote on Windows with VS2019
For CryptoNote (core):
- From the start menu, open Developer Command Prompt for VS 2019.
cd <your_cryptonote_directory>mkdir buildcd buildcmake -G "Visual Studio 16 2019" -A x64 .. -DBOOST_ROOT=B:/local/boost_1_71_0MSBuild CryptoNote.sln /p:Configuration=Release /p:PlatformToolset=v141 /m
- Download the Build Tools for Visual Studio 2019 Installer
-
WordPress’s Free .Blog Subdomain Names
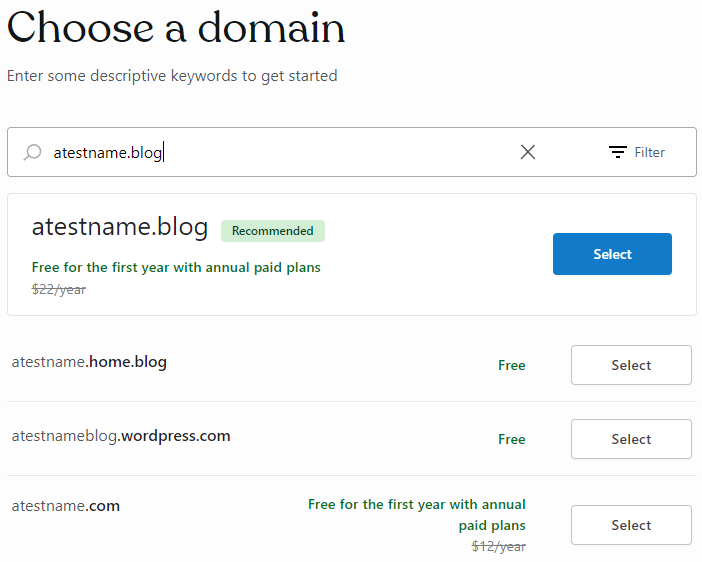
Have you ever been making a free site with wordpress, and wondered just how many .blog subdomain names there are in total?
After all, they will only show you one at a time, and it is the one that they think is related to your URL name.
Well I was wondering this myself while making a new blog, and I was shocked at just how difficult it was to find a list of every .blog subdomain offered by WordPress!After sleuthing the internet and checking them myself, I created a list of all the .blog subdomains offered by WordPress for free.
A .blog subdomain looks something like this: https://yourblogname.{subdomain}.blog
Take for example my blog, the name is JoshuaPaulBarnard, and the subdomain name is tech. This gives us a URL of https://JoshuaPaulBarnard.tech.blogSo here is my list of all the subdomain names available.
art
business
car
code
data
design
family
fashion
finance
fitness
food
game
health
home
law
movie
music
news
photo
poetry
politics
school
science
sport
tech
travel
video
waterIf anyone knows of any additional subdomain names, please leave them in a comment below.
-
Super Bowser Bros
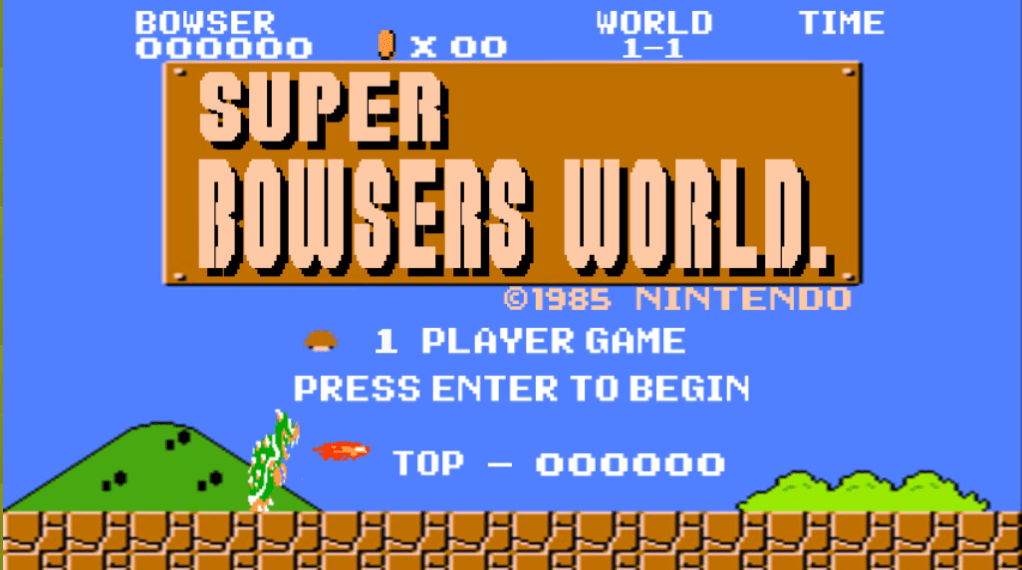
Super Bowser Bros
A game I made for my Game Design class at the Santa Rosa Junior College in the Fall of 2018.
Your kingdom has been troubled by some rather pesky plumbers from another world.
You have to make your way back to your castle collecting your coins and getting rid of those pesky Mario and Luigi who keep trying to steal what is yours.
Made using JavaScript and the Phaser CE library.Try it out at: https://joshuapaulbarnard.github.io/Super_Bowser_Bros
Github: https://github.com/JoshuaPaulBarnard/Super_Bowser_Bros
-
Interactive Wine Aroma Wheel
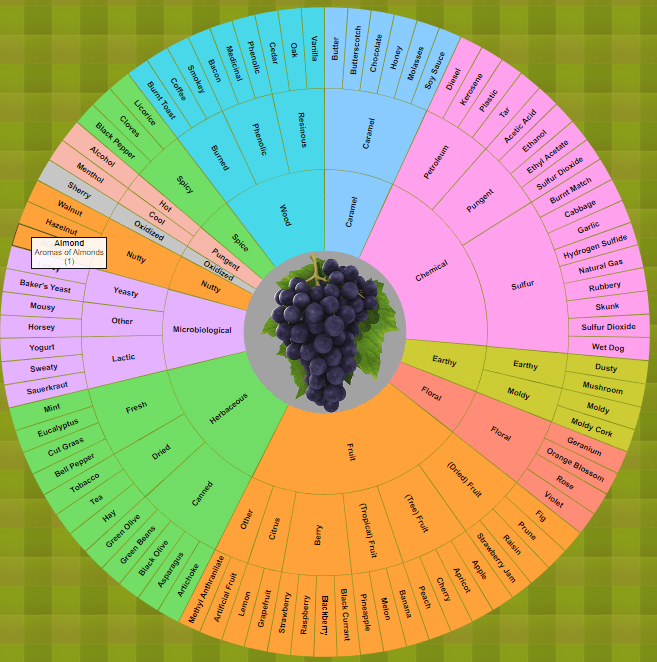
https://github.com/JoshuaPaulBarnard/Interactive_Wine_Aroma_Wheel
An Interactive Wine Aroma Wheel based on the Davis Wine Wheel by A.C. Noble. This is a zoomable and partitioned sunburst chart made using the D3.js v3 JavaScript Library. Clicking on the partitions will zoom-in on to that segment, with sub-categories radiating out.
“The Davis Wine Aroma Wheel is divided into several sections to help you visualize the different flavors, scents and aromatic qualities found in most red and white wines, regardless of the grape variety. The same aromatic complexities and sensations pictured on the wine aroma wheel are found in red and white wines all over the world, from Bordeaux, to California and the Rhone Valley, as well as every other viticultural area.”
You can view the Wine Aroma Wheel at:
https://joshuapaulbarnard.github.io/Interactive_Wine_Aroma_Wheel/ -
Changes to Website and Blog
Hello Everyone! 🙂
I hope we are all doing well.
This announcement is to inform everyone of the changes which have gone on the last few months with my personal website and blog.
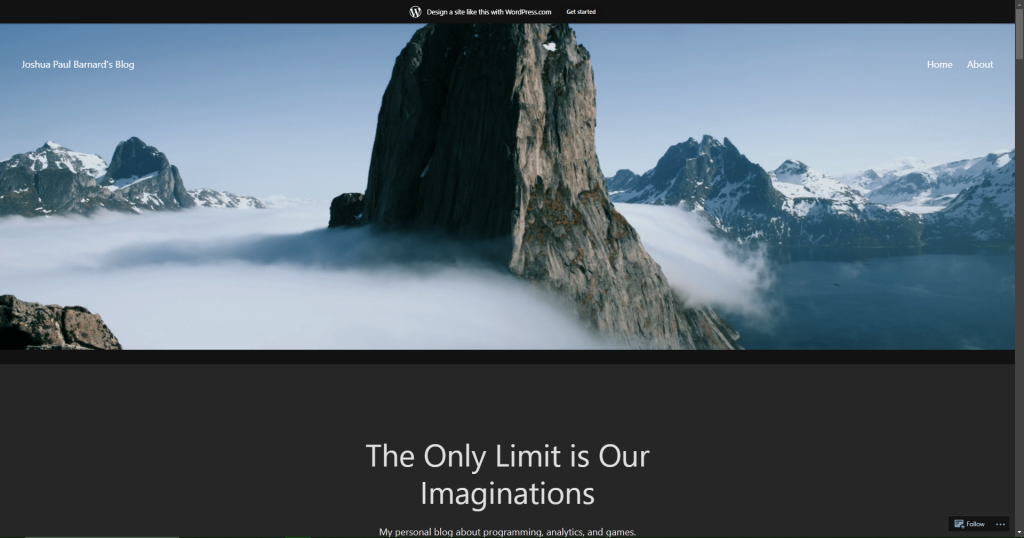
With my Website, I have transferred the hosting over to github. So while JoshuaPaulBarnard.com still works as the URL, do not be alarmed when you are instead forwarded to JoshuaPaulBarnard.github.io. The website is still a work in progress, and will slowly become more content-rich.
With the blog, I will no longer be retaining the domain name of joshuapaulbarnard.net. Instead, I have transferred the hosting to WordPress, and the new domain for my blog is JoshuaPaulBarnard.tech.blog. I made a brand new theme for this blog, and I hope you all like it!
My website is intended to be a collection of my projects, and a resource for the services I provide.
The Blog is intended to share interesting information, along with my code, research, and projects.
My Github is intended to be my resume and primary resource for projects.That’s all for now.
Take Care!
Josh -
Predicting Wine Quality

Predicting Wine Quality by comparing Linear Regression with Machine Learning techniques.
Comparing Linear Regression with kNN, Decision Tree and Random Forest with Bayesian Inference to Predict Wine Quality in Python.
We use python and Jupyter Notebook to download, extract, transform and analyze data about the physicochemical properties which make up wine, and use them to predict quality.
wine_quality.db is the database file which can be recreated with the wine_quality.sql scheme by running the wine_quality_ETL.py script.
Use the “Wine Quality.ipynd” to see the indepth analysis yourself.
Wine_Quality-Presentation.tex contains the code for the presentation, made in LaTeX.
models.py contains the the linear regression models which we use for our analysis.
A video recording of me going through the presentation can be viewed at: https://youtu.be/QpNIjdjWO0Q
The code is available on github, at: https://github.com/JoshuaPaulBarnard/Predicting-Wine-Quality
Credits :
- P. Cortez, A. Cerdeira, F. Almeida, T. Matos and J. Reis. Modeling wine preferences by data mining from physicochemical properties. In Decision Support Systems, Elsevier, 47(4):547-553, 2009. Available at: http://www3.dsi.uminho.pt/pcortez/wine/
-Charters, S. and Pettigrew, S., 2007. The dimensions of wine quality. Food Quality and Preference, [online] 18(7), pp.997-1007. Available at: https://doi.org/10.1016/j.foodqual.2007.04.003
MIT License Copyright (c) 2022 Joshua Paul Barnard.
-
CryptoNote Emissions Calculator
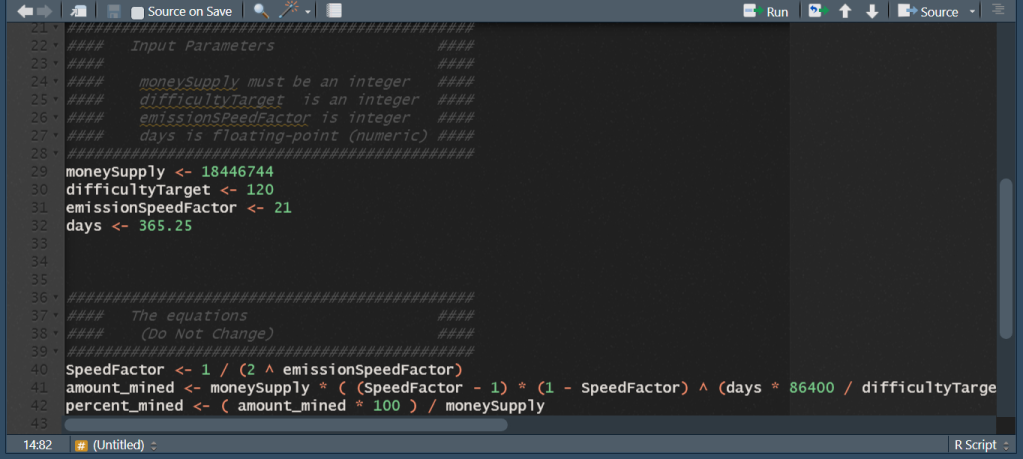
To estimate the number of coins which will be mined from the beginning of a CryptoNote-based Coin.
https://github.com/JoshuaPaulBarnard/CryptoNote-Emissions-Calculator
Inputs:
- moneySupply – The total amount of coins to be mined.
- difficultyTarget – The ideal time period between blocks. In case an average time between blocks becomes less than difficulty target, difficulty increases. Difficulty target is measured in seconds.
- emissionSpeedFactor – There is a slight decrease of block reward each block, which defines emission curve slope. This parameter is required to calulate block reward.
- days – Is the number of days to estimate (starting from day 0).
Results:
- amount_mined – The total number of coins estimated to be mined.
- percent_mined – The estimated percent of all coins mined.
Credits :
- CryptoNoteStarter : Forking guide to create your own anonymous cryptocurrency based on CryptoNote technology and ring signatures.
MIT License Copyright (c) 2023 Joshua Paul Barnard.
-
Quick Walkthrough of Pumpkin Town in Discworld MUD
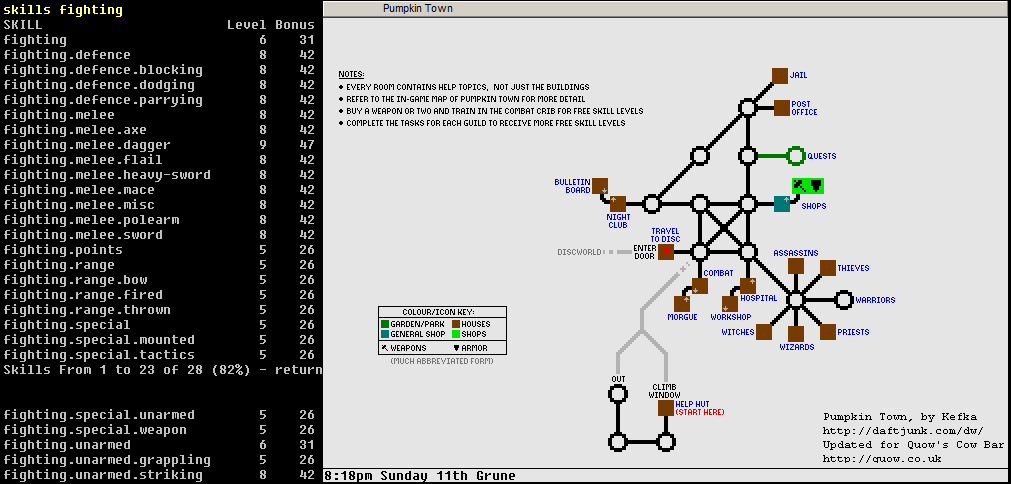
Quick Walkthrough to Pumpkin Town – Discworld MUD This quick walkthrough to starting your adventure in Discworld MUD will get your characters 5 points in Covert, Faith, Magic & Fighting, along with 8 points in Fighting.Defence, Fighting.Melee and Fighting.Unarmed.Striking before even entering the disc.
Note: This is not a copy/paste startup for people who do not know how to play, but step-by-step instructions on what I do when I create a new character. You are expected to already know how to do all the commands to complete each step. If you do not, then I recommend playing the game until you do, then restarting your character by using the “refresh” command.
- Drop map, guide and sash.
- Go to the Wizards guild room, accept the job, and complete it.
(Note: the scroll seems to be outside, and not inside a room) - Go to the Assassins guild room, accept the job, and complete it.
(Note: target seems to always be in another guild room) - Go to the Witches guild room, accept the job, but DO NOT complete it.
- Go to the Thieves guild room, accept the job, but DO NOT complete it.
- Go to the shop, then sell the champagne bottle and ice bucket.
(Note: If you need a little extra money, you can get free torches from the night club and sell them at the store) - Buy a dagger, short sword, mace, flail, spear, hatchet, and shield.
(Note: the shop downstairs has lower prices) - Shoplift Jagged Bone Sword.
- Go to the river’s shore and Remove the heart from Garry Glue’s corpse.
- Go to the Priests guild room, and offer the heart to Sek.
(Note: This will not affect your alignment, but if you are going to be a priest then you should do the quest for your god) - Go to Warrior guild room, say yes, and complete all the tasks.
- Go to the combat room and practice attacking the pumpkin with each weapon until their skill is 8; including misc, parry, blocking and unarmed.striking. Then practice your primary weapons to level 9, or until you cannot anymore.
(Note: You seem to be limited in how many times you can attack the pumpkin, not in the duration of time you are attacking it. So make as few attack commands as possible, and allow each attack to stop naturally.) - Complete the Witches quest.
- Complete the Thieves quest.
- Sell/buy whatever gear you want for your character.
- Choose your starting region, and Enter the Discworld.
-
Custom Regions (Territories) – Tableau Example #3
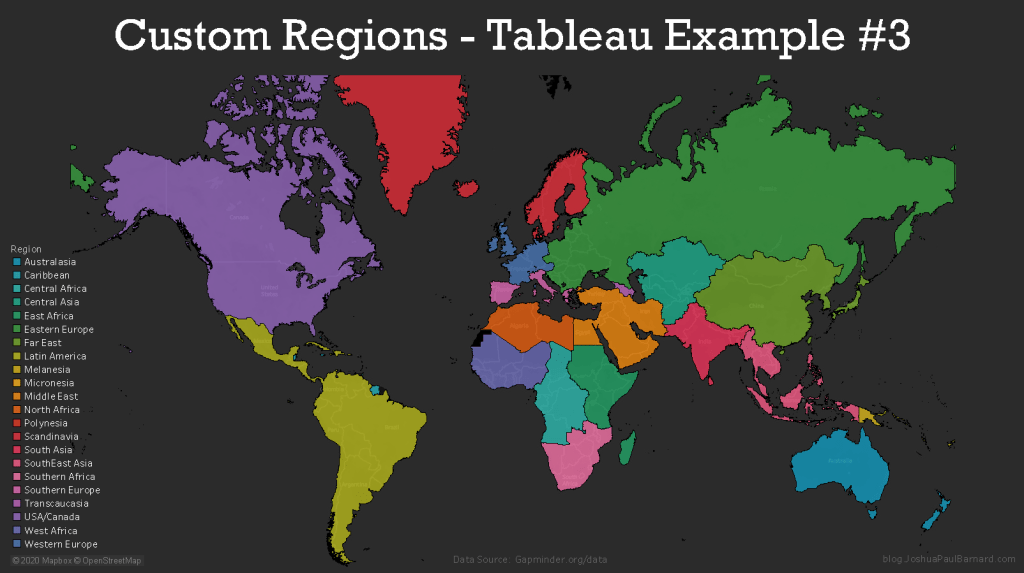
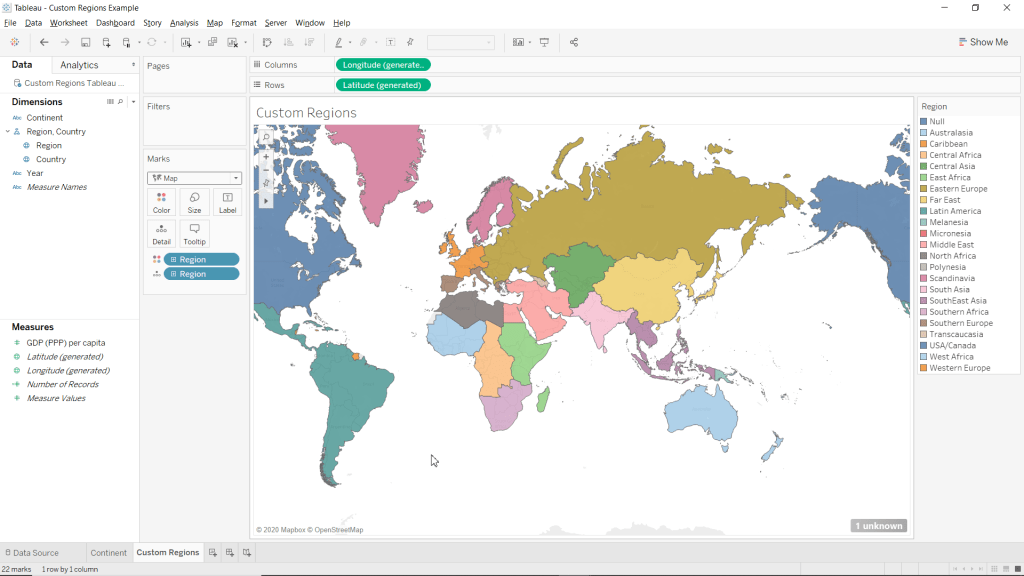
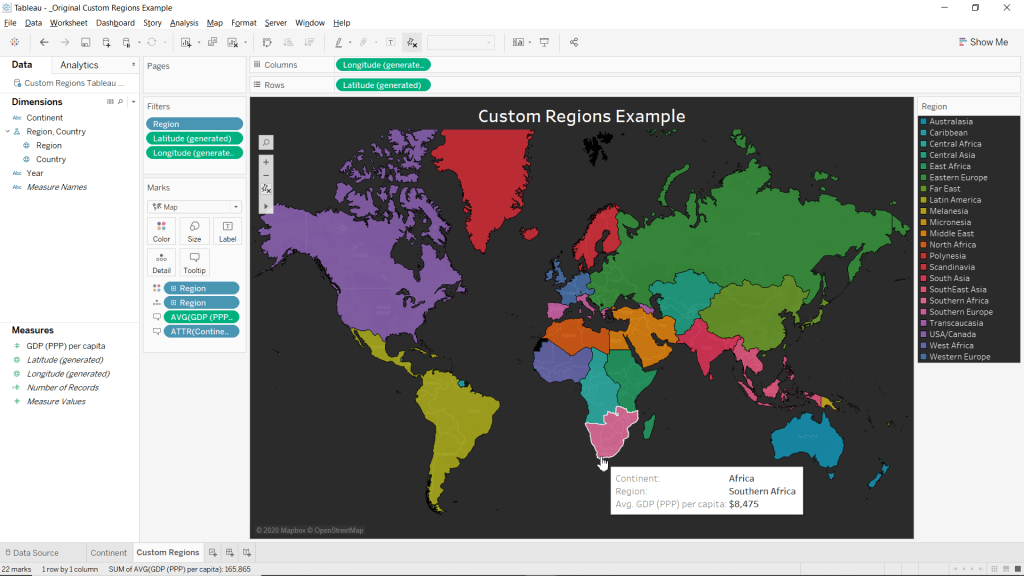
In this example we will demonstrate how to create our own custom regions (territories) with groups of data which are not provided by Tableau’s robust geographic engine. Creating custom regions is very useful for visualizing information about regions relevant to your analysis, such as counties within a state or countries within a continent. Not only does Tableau allow us to visualize these custom regions, but we can also do calculations using these regions as groups. In this example we will be using our custom coded data from our the previous tutorial. In this example we will create two separate maps, the first map will show the individual countries grouped by their continent by colour, and the second map will only show our custom regions using the data from each country (and is the cover image for this example).
To create custom regions in Tableau you must code the region information into your data manually, and I covered how to do this in the previous post Creating Custom Regions with Large Data Sets – Tableau Prep Example #1. If you want to do not want or need to learn how to manually code this type of data to a large dataset, then you can download the finished dataset ready to use as a .csv (instead of .hyper).
You can view the Video of this walk-through, but I recommend reading through the steps first before watching the video guide.
In our example we will be using data from Gapminder.org and you can download the data here.
This example was made using Tableau Desktop 2020.1
Step 1: Initial Setup
If you are following along my previous post
- Connect to Custom Regions Tableau Example.hyper (or .csv)
- Optional: Download Custom Regions Tableau Example.csv
- Open Tableau Desktop
- Click File in the menu bar
- Select Open…
- Navigate to your files location
- Select Custom Regions Tableau Example.hyper (or .csv)
- Click Open
- Rename Sheet 1 to Continent
- Right-click the Sheet 1 worksheet tab in the bottom left corner of the screen
- Select Rename
- Type Continent
- Press the Enter key
- Create a new blank worksheet and rename it to Custom Regions
- Click Worksheet in the menu bar
- Select New Worksheet
- Right-click the Sheet 2 worksheet tab in the bottom left corner of the screen
- Rename Sheet 2 to Custom Regions
- Press the Enter key
- Save your workbook as Custom Regions Example
- Click File in the menu bar
- Select Save As…
- Type Custom Regions Example
- Navigate to where you want to save the project
- Click Save
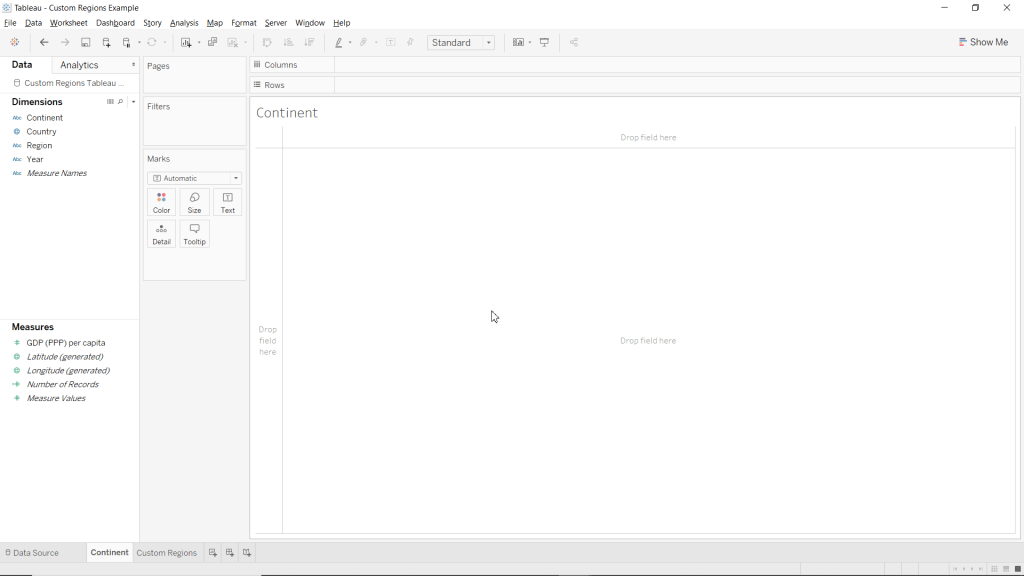
Step 2: Create Map showing Countries within Continents
Now we are going to use our custom coded variables to create a map of the world’s countries grouped by colour by which continent they are in.
- Make the Continent worksheet active
- Drag Latitude (generated) to Rows
- Drag Longitude (generated) to Columns
- Drag Country to the Detail mark
- Drag Continent to the Color mark
- Change the Marks type to Map
- Click Automatic in the drop-down menu at the top of the Marks card
- Select Map
Now you just created a filled map chart with custom regions without using the Show Me menu! This is a great way to show information about the individual countries while showing their affiliation to a larger group.

Step 3: Create Map of World’s Continents
We are now going to use custom coded regions and hierarchies to create a map of the for our custom regions.
- Make the Custom Regions worksheet active
- Change Region to a geographic role
- Right-click Region (under Dimensions)
- Highlight Geographic Role
- Highlight Create from
- Select Country
- Drag Latitude (generated) to Rows
- Drag Longitude (generated) to Columns
- Drag Region to the Detail mark
- Drag Region to the Color mark
- Select Add all members
- Change the Marks type to Map
- Click Automatic in the drop-down menu at the top of the Marks card
- Select Map
Now that we have created our map with continents thanks to our custom regions, we can add measures to the Tooltip to show information about our custom regions. This is one of the main benefits of using such a feature, is being able to aggregate and display information on each custom region from the data you have on each area within that region.
Step 4: Formatting
Here we can edit our Custom Regions map to be a bit more appealing and display more information.
- Drag Continent to the Tooltip mark
- Add the Average for GDP (PPP) per capita to the maps tooltip
- Drag GDP (PPP) per capita to the Tooltip mark
- Right-click the SUM(GDP (PPP) per capita) pill in the Marks card
- Highlight Measure(SUM)
- Select Average
- Remove map borders
- Right-click anywhere within the ma
- Select Format…
- Click the Pane drop-down menu for Row Divider
- Select None
- Click the Pane drop-down menu for Column Divider
- Select None
- Close the Format Borders pane.
- Change map background to Dark
- Click Map from the main menu bar
- Highlight Background Maps
- Select Dark
- Match Worksheets background to your maps ocean water’s colour
- Click Format from the main menu bar
- Click the drop-down menu for Worksheet under the category Default
- Click More Colors…
- Click Pick Screen Color
- Click anywhere within the maps ocean
- Click OK
- Close the Format Shading pane
- Edit the Title to say Custom Regions Example
- Double-click the Title
- Type Example
- Highlight all the text
- Increase Font-size to 20
- Bold the text
- Center Align the text
- Click OK
- Change the Colour palette to Hue Circle
- Click on the Color mark
- Select Edit Colors…
- Select Hue Circle from the Select Color Palette: drop-down menu
- Click Assign Palette
- Click OK
- Add a Dollar Sign ($) in front of GDP (PPP) per capita in the Tooltip
- Click the Tooltip mark
- Click right infront of <AVG(GDP (PPP) per capita)>
- Change font color to Black
- Type $
- Click OK
Please follow me on social media:
YouTube
Reddit
Tableau Public Profile
My Personal Blog
JoshuaPaulBarnard.com - Connect to Custom Regions Tableau Example.hyper (or .csv)
-
Subscribe
Subscribed
Already have a WordPress.com account? Log in now.
